I've been playing around with
Google Analytics the last few days. It's really cool. This is a Google service that tracks who visits your site. It's pretty cool. It displays such things as your top five pages, how long did the average pageview lasted, and geographic location of the visitors.
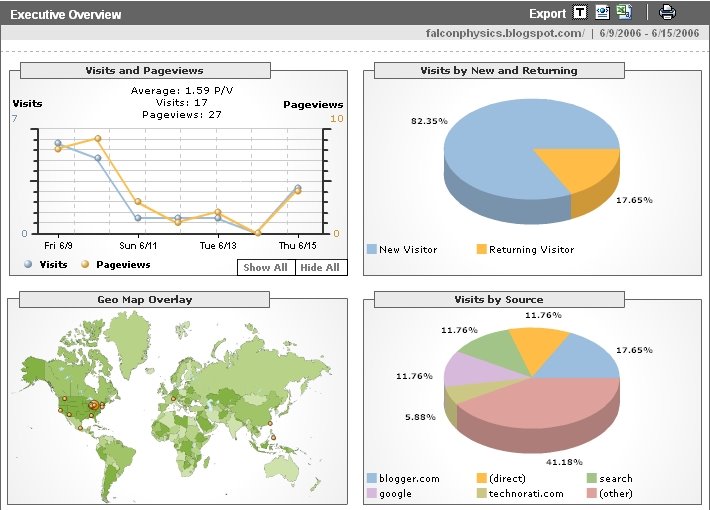
Here's a screenshot of the Executive Overview:

When you mouse over the dots on the map it displays the city name. It is really cool to see that people are occasionally visiting your site and even cooler to see they are from around the world.
There are a number of ways to use this in education. If you have a class site where your students share content this would provide a great way to motivate them. It's one thing to say people out there could be reading their stuff and quite another to be able to show them people are.
The dots on the map also change. Some go away. Students could be tasked with adding them to a
Google Earth *.
kml file. Once there, students can zoom in and get a much better idea where their readers live.
You could also collect daily or monthly data over time and create your own excel graphs to be worked with or manipulated as you (or your students) see fit.
If you have your own website you use to share info with students you could also use this service to see how many actually use it and how often they check it.