Google Earth allows for the creation of custom content by users. The easiest way is to create a kml or kmz file. kml and kmz files are fairly easy to create (or modify). It is just a mark-up language. If you can code html you can code kml files (they're not the same, but are similar). KML Tutorial. For those who don't want to delve into the code you can create these files within Google Earth itself. I mention kml amd kmz because this is the format you will save Google Earth files in if you want to make them available for others.
A kml file is simply a small text file with instructions for Google Earth to interpret. KMZ files are compressed archives of files. A KMZ file includes the KML file and any other files (like pictures) the KML refers to. I was playing around the other day and created a KMZ file from a nature walk (crosswinds marsh.kmz) my son and I took. I plotted our path (using my GPS) and took pictures along the way. I placed pins in Google Earth and edited their descriptions, to include the pictures. You can use html code in the description to change text style, include links to the web, bring in pictures, or even some web videos. I put the path and the pins in a folder in GE and saved the folder as a KMZ file.
I created the path using GPS Visualizer, a web application that converts GPS files to other formats, including KML or KMZ files. This allows me to use my GPS unit with the free version of Google Earth. Normally, you can only use a GPS unit with Google Earth Plus.
In the newest version of Google Earth Beta 4 they took some of the premium features from the paid version and brought them over to the free version, including the ability to create paths and polygons. So, if you don't have access to a GPS unit it would be easy enough to draw a nature walk and incorporate pictures from the walk as pins. Or have a student studying the Tundra biome outline the tundra and have pins marking points of interest with pictures and information. This would be a lot more fun than having the exact same information in a report or powerpoint presentation.
HTML Primer for Google Earth: This shows some very basic html code you can use in your placemarks within Google Earth. A quick search of the internet will yield a lot more.
Google Earth in Physics
For more go to the Google Earth Page on FLOSScience.com
Showing posts with label gis. Show all posts
Showing posts with label gis. Show all posts
Friday, August 08, 2008


Monday, July 21, 2008
GIS - Geographic Information Systems
I taught Environmental Science a number of years ago and I came across all of this then. Some of this material may be a little outdated. I will be working on it this summer to help out a good friend of mine who will be teaching Environmental Science this year. GIS, or Geographic Information Systems, is basically taking data and plotting it on maps. By mapping the data it is often much easier to spot patterns or trends. In education GIS can be a perfect tool for inquiry based labs.
The simplest GIS activity I've ever done with my class was to pass out maps of South East Michigan that I'd gotten from the Secretary of State or the Department of Transportation (I can't remember which). Then in groups of trhee I had students use markers or crayons to trace all th rivers and streams. By highlighting this data students were able to quickly identify the different watersheds in our area. We live in the Rouge River Watershed which covers a large area and funnels down to one very polluted river. Once the watershed was "outlined" in this way it was easy for students to understand why it is still so polluted even given all the programs aimed at changing this.
GIS becomes even more powerful when we bring the power of computers to bear. Below are listed some free programs for analyzing data. The easiest is probably Google Earth, but I highly recommend giving ArcExplorer a try.
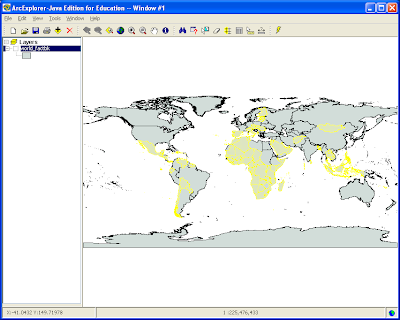 I created this map as an example of some of the cool questions you can ask. It was created in ArcExplorer using data from the 2006 CIA World Fact Book. The highlighted countries have more than twice as many active cell phones as traditional telephones. This is really cool, it demonstrates how many developing countries are leap-frogging technologies and not even bothering to build the infrastructure necessary to support more out dated traditional phones.
Cross posted from www.flosscience.com
The simplest GIS activity I've ever done with my class was to pass out maps of South East Michigan that I'd gotten from the Secretary of State or the Department of Transportation (I can't remember which). Then in groups of trhee I had students use markers or crayons to trace all th rivers and streams. By highlighting this data students were able to quickly identify the different watersheds in our area. We live in the Rouge River Watershed which covers a large area and funnels down to one very polluted river. Once the watershed was "outlined" in this way it was easy for students to understand why it is still so polluted even given all the programs aimed at changing this.
GIS becomes even more powerful when we bring the power of computers to bear. Below are listed some free programs for analyzing data. The easiest is probably Google Earth, but I highly recommend giving ArcExplorer a try.
- NASA World Wind - Free and Open Source program from NASA. Visualize the Earth as a 3D globe that you can easily map a variety of data onto. Yes, I know this sounds a lot like Google Earth. It is not quite as easy to use as Google Earth, but it already includes much of the scientific data that you have to download separately and add into Google Earth. You should give it a look and see if it will give you a few more things than GE will. It also includes the Moon and Mars. Be sure to check out the World Wind Wiki for more info and add-ons. The World Wind Wiki offers a comparison with Google Earth. Or if you prefer, here's a 3rd party comparison.
- Google Earth Ideas - Google Earth is free from Google, although there are paid versions as well. The newest version allows for easy integration of SketchUp Buildings.
- Arc Voyager SE - Cool program that comes with ready made activities. ArcVoyager really begins to show the power of GIS. (This is still available, but it has been supplanted by Arc Explorer. Personally I haven't used ArcExplorer in class yet, which is why I still list ArcVoyager)
- Create Custom Maps from online data. (Earth Exploration Toolbook)
- Earth Science Lesson focusing on mapping earthquake data. (Earth Exploration Toolbook)
- Looking into the Earth using earthquake wave speed data. (Earth Exploration Toolbook)
 I created this map as an example of some of the cool questions you can ask. It was created in ArcExplorer using data from the 2006 CIA World Fact Book. The highlighted countries have more than twice as many active cell phones as traditional telephones. This is really cool, it demonstrates how many developing countries are leap-frogging technologies and not even bothering to build the infrastructure necessary to support more out dated traditional phones.
Cross posted from www.flosscience.com
Wednesday, November 15, 2006
I wish I taught Earth Science
While helping a colleague play with Google Earth I discovered a cool website put together by the National Weather Service. You can download their weather radar loops into Google Earth.
The site will create a KML file for the selected radar which can be opened in Google Earth or NASA World Wind (I haven't tried World Wind with this yet). The data are real time and use the time slider that was added to Beta 4. You can hit play and watch or you can drag the slider back and forth. Each frame has to be loaded, so it can take a little time. You'll want to load it up prior to showing it to students. Some times it loads fast and other times it is fairly slow.
You can download different sectors and show them all at the same time. The one time slider will cycle all the open sectors at the same time. Goto the National Weather Service Enhanced Radar Images and check it out. You can of course simply view the loops as video files without bothering with Google Earth. The additional of Google Earth may not add much educational value, but it can make for a great anticipatory set.
Technorati Tags: GIS, Google Earth, weather, world wind, education, falconphysics
The site will create a KML file for the selected radar which can be opened in Google Earth or NASA World Wind (I haven't tried World Wind with this yet). The data are real time and use the time slider that was added to Beta 4. You can hit play and watch or you can drag the slider back and forth. Each frame has to be loaded, so it can take a little time. You'll want to load it up prior to showing it to students. Some times it loads fast and other times it is fairly slow.
You can download different sectors and show them all at the same time. The one time slider will cycle all the open sectors at the same time. Goto the National Weather Service Enhanced Radar Images and check it out. You can of course simply view the loops as video files without bothering with Google Earth. The additional of Google Earth may not add much educational value, but it can make for a great anticipatory set.
Technorati Tags: GIS, Google Earth, weather, world wind, education, falconphysics
Thursday, November 02, 2006
Google Earth Keeps getting better
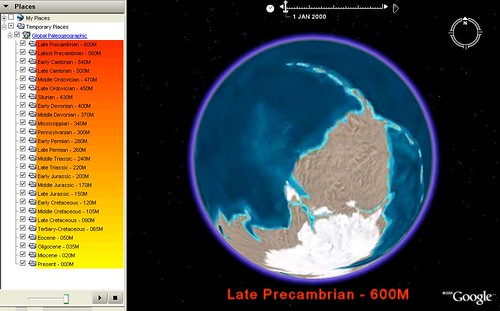
I was just checking the Google Earth Blog (something I need to do much more often) when I stumbled across something I've been wanting for a while. You can now do Plate Tectonics with Google Earth.
I just love it when people create cool content that I need. I suppose need is very relative since I don't teach any Earth Science anymore.
Once you download the kml file you'll have to wait for each of the time frames to load. The you can drag the slider in the thing that appeared at the top of the window or just click the play button next to the slider.
Technorati Tags: GIS, Google Earth, education, falconphysics
Thursday, July 20, 2006
Fun with Google Earth
If you haven't tried out Google Earth yet you really need to give it a try. Be sure to download the newest version Beta 4. In this version they really made some great improvements in the user interface. It is rapidly becoming my favorite program for GIS. In the past I've blogged about NASA's WorldWind, which is a bit more useful in science, but Google Earth is so much easier to use. Additionally people have been creating some great content that brings Google Earth closer and closer to World Wind.
I discussed that in a podcast a couple other educators and I are starting. As soon as the first episode is done being edited I'll post it here.
Anyway, since recording the podcast I've been playing around a little more. Upon reading a guide for using Google Earth in Earth Science I discovered that it is really easy to create image overlays in Google Earth. It really is easy. Get Google Earth to display your region of interest in approximately the same view as your picture and zoom out a little. Then just select "Image Overlay" from the Add menu. Use the browse button in the window that opens to select your image (or paste in the url). You will see handles for dragging the corners, edges or center. There is also one for rotating the image. You will also need to adjust the opacity, using a slider in the overlay window. Just play with the adjustments until you are satisfied.
NASA Visible Earth - Is a great place to go for overlays in Google Earth if you want to get views of the same area from different times.
You could also scan in images from a textbook, say maps showing the growth of the Roman Empire for example. These images get draped over the globe, so they still have the same topography when the display is tilted.
Technorati Tags: GIS,Google Earth, education, falconphysics
I discussed that in a podcast a couple other educators and I are starting. As soon as the first episode is done being edited I'll post it here.
Anyway, since recording the podcast I've been playing around a little more. Upon reading a guide for using Google Earth in Earth Science I discovered that it is really easy to create image overlays in Google Earth. It really is easy. Get Google Earth to display your region of interest in approximately the same view as your picture and zoom out a little. Then just select "Image Overlay" from the Add menu. Use the browse button in the window that opens to select your image (or paste in the url). You will see handles for dragging the corners, edges or center. There is also one for rotating the image. You will also need to adjust the opacity, using a slider in the overlay window. Just play with the adjustments until you are satisfied.
NASA Visible Earth - Is a great place to go for overlays in Google Earth if you want to get views of the same area from different times.
You could also scan in images from a textbook, say maps showing the growth of the Roman Empire for example. These images get draped over the globe, so they still have the same topography when the display is tilted.
Technorati Tags: GIS,Google Earth, education, falconphysics
Tuesday, July 19, 2005
Google Earth
I've been praising NASA's World Wind and not mentioning Google Earth much. Google Earth is a great program, I just think World Wind is better. That said Google Earth is a smaller download and seems to run a little smoother.
World Wind is definitely better for education (see previous posts), Google Earth is better for consumers. Users out there have created add-ons for Google Earth that can be found at googleearthhacks.com
World Wind is definitely better for education (see previous posts), Google Earth is better for consumers. Users out there have created add-ons for Google Earth that can be found at googleearthhacks.com
Monday, July 18, 2005
World Wind Issues
I currently have two desktop computers up and running at home. My new one, P4 3.0GHz with 512MB RAM, and my old one (which my son uses), a P3 866MHz. World Wind runs on both machines. A little slower on my old machine, but fast enough. There is a problem, however.
On my new machine I run into problems while tilting the display to see 3D terrain features (I don't have this problem in Google Earth). My Old machine does this just fine. The difference is my old machine has a dedicated graphics card and my new machine uses Intel Extreme (or some such) which is on the motherboard and has no dedicated video RAM.
If you are going to be tilting the Earth (which is really cool) you must have a video card. If you don't have a video card there is still a lot you can do, however. You can check to see if your card is compatible at the World Wind Wiki.
If you're not sure what video adapter you have you should download a system information utility. I really like Belarc Advisor, it tells you everything including which if any windows updates you may still need to install.
On my new machine I run into problems while tilting the display to see 3D terrain features (I don't have this problem in Google Earth). My Old machine does this just fine. The difference is my old machine has a dedicated graphics card and my new machine uses Intel Extreme (or some such) which is on the motherboard and has no dedicated video RAM.
If you are going to be tilting the Earth (which is really cool) you must have a video card. If you don't have a video card there is still a lot you can do, however. You can check to see if your card is compatible at the World Wind Wiki.
If you're not sure what video adapter you have you should download a system information utility. I really like Belarc Advisor, it tells you everything including which if any windows updates you may still need to install.
Sunday, July 17, 2005
World Wind
World Wind is a great program for visualizing the earth created by NASA. It is similar in some respects to Google Earth. Overall I'd say Google Earth is easier to use and runs more smoothly, but it is also less powerful.
In general I see Google Earth being more useful as a geography tool. World Wind is a much bigger program (over 150 MB download) and has a lot more features. Both programs rely on online databases for data and therefore require an active connection to the internet.
Both programs seem to reference similar data sets of satellite photos, but World Wind will also display contour maps, MODIS, GLOBE, and NASA SVS (a set of animations showing change over time).
MODIS is a set of satellite images that are updated daily and provide a resolution of 250 m per pixel. The images don't typically show the entire Earth every day, but do show recent images. GLOBE data includes a variety of data types including: temperature, cloud cover, and barometric pressure among others. This data is updated daily and can be displayed for the entire world.
There are also a number of user created add-ons available. World Wind is Open Source and has spawned an active community of users/creators. Many add-ons can be found at the World Wind Wiki.
What's the cost for this great program? Its free.
In general I see Google Earth being more useful as a geography tool. World Wind is a much bigger program (over 150 MB download) and has a lot more features. Both programs rely on online databases for data and therefore require an active connection to the internet.
Both programs seem to reference similar data sets of satellite photos, but World Wind will also display contour maps, MODIS, GLOBE, and NASA SVS (a set of animations showing change over time).
MODIS is a set of satellite images that are updated daily and provide a resolution of 250 m per pixel. The images don't typically show the entire Earth every day, but do show recent images. GLOBE data includes a variety of data types including: temperature, cloud cover, and barometric pressure among others. This data is updated daily and can be displayed for the entire world.
There are also a number of user created add-ons available. World Wind is Open Source and has spawned an active community of users/creators. Many add-ons can be found at the World Wind Wiki.
What's the cost for this great program? Its free.
Subscribe to:
Posts (Atom)

