The simplest GIS activity I've ever done with my class was to pass out maps of South East Michigan that I'd gotten from the Secretary of State or the Department of Transportation (I can't remember which). Then in groups of trhee I had students use markers or crayons to trace all th rivers and streams. By highlighting this data students were able to quickly identify the different watersheds in our area. We live in the Rouge River Watershed which covers a large area and funnels down to one very polluted river. Once the watershed was "outlined" in this way it was easy for students to understand why it is still so polluted even given all the programs aimed at changing this.
GIS becomes even more powerful when we bring the power of computers to bear. Below are listed some free programs for analyzing data. The easiest is probably Google Earth, but I highly recommend giving ArcExplorer a try.
- NASA World Wind - Free and Open Source program from NASA. Visualize the Earth as a 3D globe that you can easily map a variety of data onto. Yes, I know this sounds a lot like Google Earth. It is not quite as easy to use as Google Earth, but it already includes much of the scientific data that you have to download separately and add into Google Earth. You should give it a look and see if it will give you a few more things than GE will. It also includes the Moon and Mars. Be sure to check out the World Wind Wiki for more info and add-ons. The World Wind Wiki offers a comparison with Google Earth. Or if you prefer, here's a 3rd party comparison.
- Google Earth Ideas - Google Earth is free from Google, although there are paid versions as well. The newest version allows for easy integration of SketchUp Buildings.
- Arc Voyager SE - Cool program that comes with ready made activities. ArcVoyager really begins to show the power of GIS. (This is still available, but it has been supplanted by Arc Explorer. Personally I haven't used ArcExplorer in class yet, which is why I still list ArcVoyager)
- Create Custom Maps from online data. (Earth Exploration Toolbook)
- Earth Science Lesson focusing on mapping earthquake data. (Earth Exploration Toolbook)
- Looking into the Earth using earthquake wave speed data. (Earth Exploration Toolbook)
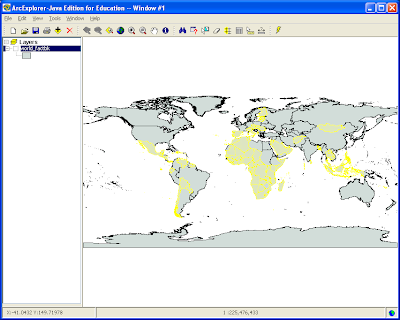
 I created this map as an example of some of the cool questions you can ask. It was created in ArcExplorer using data from the 2006 CIA World Fact Book. The highlighted countries have more than twice as many active cell phones as traditional telephones. This is really cool, it demonstrates how many developing countries are leap-frogging technologies and not even bothering to build the infrastructure necessary to support more out dated traditional phones.
Cross posted from www.flosscience.com


No comments:
Post a Comment